View
 Here you will find a number of tools to present the content of TV Renames’ database in an easily human-readable format
Statistics
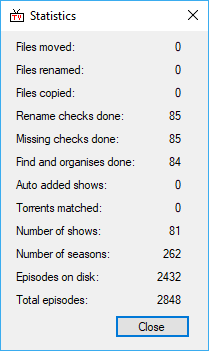 Statistics provides you with a high level summary of the content of the TV Rename database.
This statistics illustration (left) was created a few weeks after a fresh install of TV Rename was carried out (so work on updating the documentation could begin with a clean setup).
It’s surprising just how much work TV Rename does just “managing some videos”.
Note: “Episodes on disk:” may show a question mark instead of a value. Because this field takes a relatively long time to calculate a value is only displayed once a full scan has been completed.
Show Summary
Show Summary displays a table of the shows in your database with traffic light style colouring to indicate the status of a season of a show (including Specials as their own season).
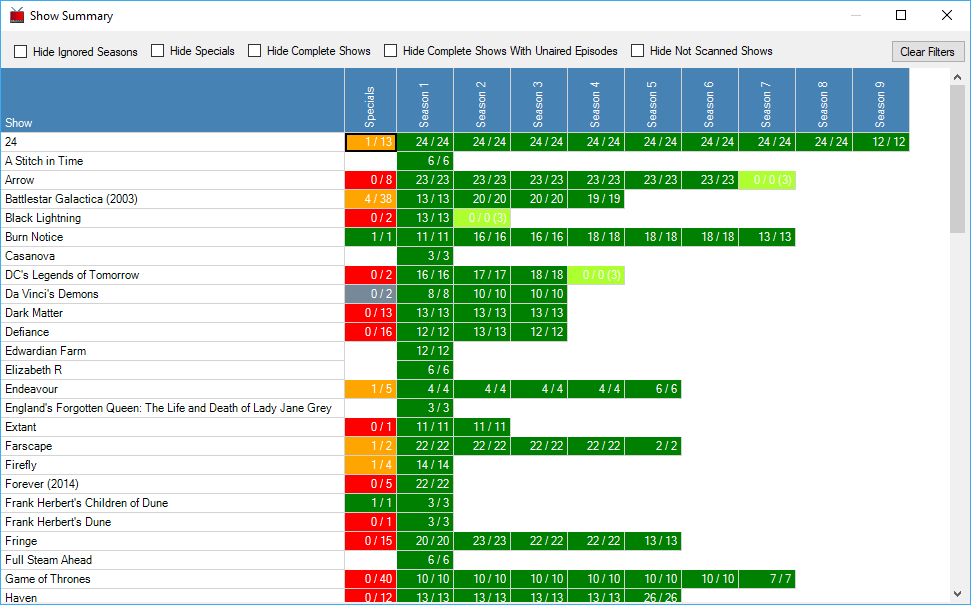
The season colouring is as follows: -
| Green | Indicates a season of a show that is complete. |
| Light Green | Indicates a season of a show which is ongoing. The numbers in brackets indicates the number of up-coming shows found in When to watch. |
| Orange | Indicates a season whose broadcast is complete but you don’t have all the available episodes in the library. |
| Red | Indicates a season whose broadcast is complete but you have no episodes. |
| Grey | Indicates a season which you have told TV Rename to ignore. |
The show name colouring is as follows: -
| Black | Indicates a show that is checked for missing episodes. |
| Grey | Indicates a show that is not checked. |
The data can also be filtered using the tick boxes at the top of the pane if required.
Actors Grid
Really like that actor in “Such-and-such”? Sure they are in other shows in your media library? This view will show you!
Among the meta-data that The TVDB collects (and you import) is information about actors, they may be a shows “core characters” or “guest stars” but the data is available for every episode of every season of every show on The TVDB (If it’s not or you know better please visit their site, log in and fix it - it’s to everyone’s benefit).
Think of a spreadsheet, with actors names along the top (and a total at the end) and show names down the side (and a total at the bottom), now make it totally dynamic and fill the matching actor/show cells in green…
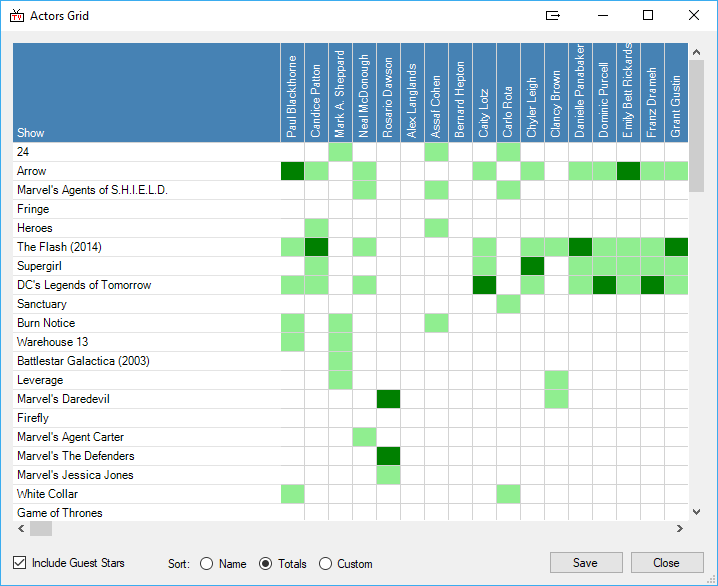
The data can be manipulated further: along the bottom of the window are an “Include Guest Stars” tick box, “Sort:” radio buttons and Save and Close buttons.
Ticking the “Include Guest Stars” box will expand the grid further to include guest stars of the shows (in light green). Sorting on “Name” will re-arrange the data alphabetically by actor name and by show name. Clicking on “Totals” will place the show with the most actors at the top of the list and the actor in the most shows to the left of the list.
Custom is automatically selected if you click on an actors or shows name.
If you click on an actors name they will be moved to the left of the grid with all the shows they appear in at the top.
Similarly, clicking on a show name will move it to the top of the grid with all the actors that appear in it moved to the left.
Clicking Save will save the entire grid as a “Portable Network Graphic” (.png) file to a path of your choosing.
The Actors Grid has one more trick up its sleeve. If you click on one of the green cells your web browser will launch targeting the actor whose column the green cell is in at the “Internet Movie Database” (IMDb.com).